How to audit B2B data Consultancy vendors for CRM data enrichment?
You’re three meetings into working out how to choose a data enrichment provider. Right now, you are comparing three decks and three accuracy percentages.…
Read more
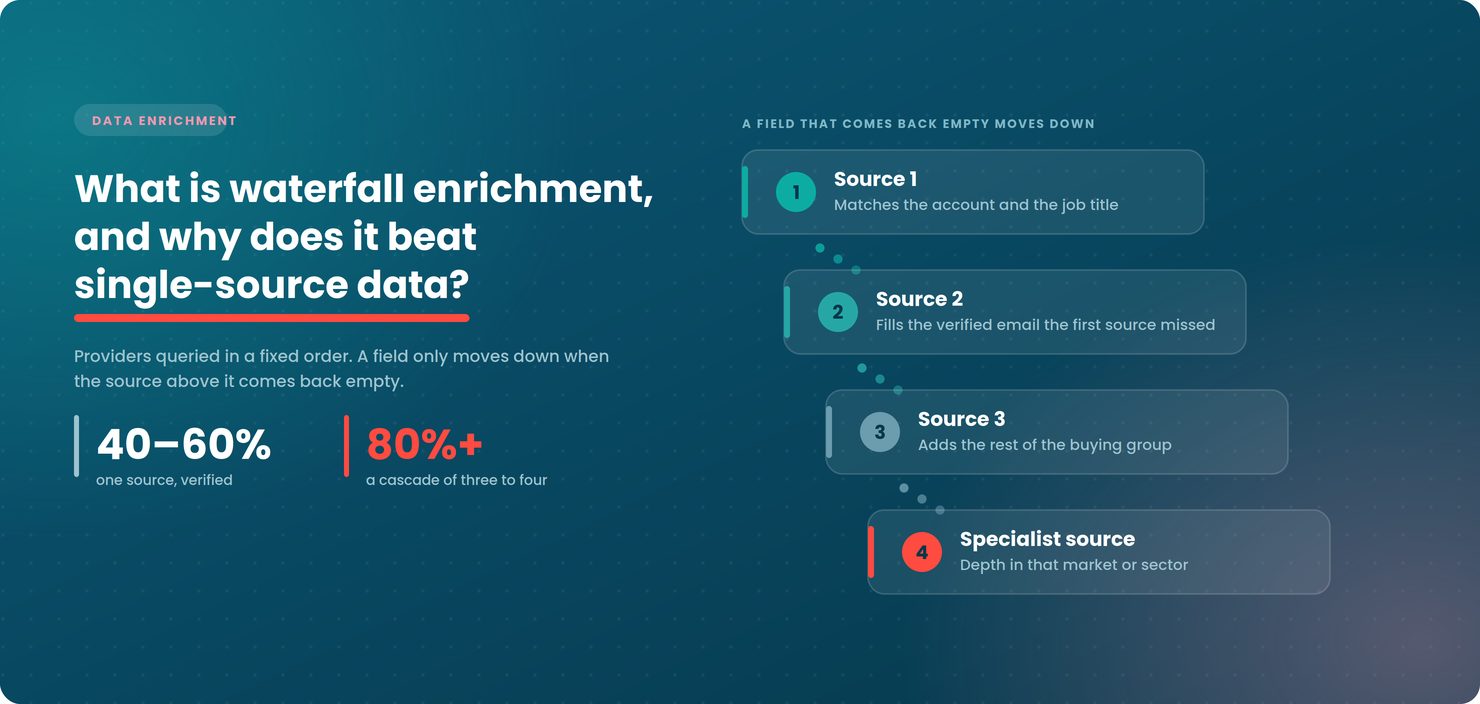
You upload a thousand target contacts to the platform you already pay for, and four hundred come back blank. No email, no direct dial, nothing. The instinct is to assume those four hundred people simply aren’t reachable. They’re not.
Some may be present in another database, collected through a different method and potentially identifiable through a source your current platform doesn’t draw from.
This is where most teams get stuck. You’ve already committed to the annual licence, so the natural move is to refine the search, widen the filters, and try again.
But this is exactly why buying data fails. When the problem is limited coverage, refining the same search or pushing the same source harder won’t uncover records it doesn’t have. Single-source data doesn’t reward that effort because the missing records may simply sit outside its reach.
Waterfall enrichment approaches the problem differently. Let’s look at how waterfall enrichment works, why single-source gaps follow predictable patterns, what the coverage lift is actually worth, and when a cascade isn’t worth running at all.
Waterfall enrichment is a process of querying multiple B2B data providers in a fixed priority order, moving down to the next provider only when the one before it returns no result, or one below your confidence threshold.
IMG (Intermedia Global Ltd) can use this approach rather than relying on a single platform. If a provider returns nothing usable, the record moves to the next source in the order, not to every source at once.
That sequencing is what makes it a cascade rather than a comparison exercise. Running three tools in parallel and merging whichever results come back is just more lookups against the same blank fields. The priority order is the method.
So how does waterfall enrichment work in practice, and why does it lift the data enrichment match rate a single platform can’t reach on its own?
That’s what the rest of this piece sets out to explore. Why one source leaves predictable gaps, how a cascade actually runs record by record, what the coverage lift is worth, and when running one isn’t justified at all.
No single provider covers everything. While this statement is true, it doesn’t tell you where your own gap will fall, or how large it will be, before you’ve spent money finding out.
The more useful fact is that those gaps aren’t random. A provider’s database is a product of how it collects data, and that collection method can influence where coverage is strong and where it is limited.
A provider built on user-contributed contacts such as syncing address books, CRM exports, and email signatures inherits the demographics of whoever uses the product. If its user base skews towards sales teams at mid-market SaaS companies, that’s where its database is deep.
A provider built on web scraping inherits whatever is publicly published, and that varies sharply by market and company size: a listed company with an active comms team publishes far more than a 40-person manufacturer.
A provider built on public filings and company registries is strong wherever filing requirements are strict and detailed, and considerably weaker where they’re not and even registry data lags a moving market.
According to ONS, Business Demography 2024, the UK alone saw roughly 317,000 new businesses start and 280,000 close in 2024, a death rate of 9.8%. Every new start is, by definition, absent from a database compiled even months earlier, and every closure typically lingers in one for a good while after.
This matters for B2B data coverage because it means you can forecast your own gap before buying anything, simply by asking which collection method a provider relies on and matching that against your own target market. Any data set needs ongoing updates to reflect a market that keeps moving.
The table below sets out the pattern. These are tendencies, not measurements — directional, and worth checking against your own target list rather than taken as fixed.
| Collection method | Usually strong on | Usually thin on |
|---|---|---|
| User-contributed contacts (CRM syncs, address books, signatures) | Roles and companies that overlap with the provider’s own customer base | Sectors and company sizes outside that customer base |
| Web scraping of public profiles and company sites | Large, outward-facing companies with active comms and careers pages | Small and mid-sized businesses with minimal public presence |
| Public filings and company registries | Markets with strict, detailed filing requirements | Markets with lighter-touch or less frequent filing obligations |
| Telephone and field-verified data | Accuracy on the fields it verifies directly | Breadth as verification doesn’t scale as fast as scraping |
| Partner and co-op data sharing | Categories the partner network already serves well | Anything outside that network’s existing footprint |
This is why waterfall enrichment vs single source isn’t really a quality argument, but any individual provider can be perfectly accurate within its own collection method. It’s a coverage argument, and coverage is shaped before a single record is ever queried.
Some of the largest data platforms are built home-market first, having stronger coverage in their core markets, where commercial demand and available data may be greatest. Coverage thins as you move outward, and for anyone running campaigns across regions, that’s the difference between a workable list and one that returns blanks on every third record.
LinkedIn shows the shape of the problem, even though membership isn’t a direct measure of coverage: roughly 250 million members in the US against around 45 million in the UK, reaching about 20.7% of adults worldwide.
Those are membership figures, not active users, but the gap between a platform’s largest market and everywhere else is the pattern that matters.
Regional and national specialist providers often offer stronger coverage than global platforms in particular markets.
This is why IMG pairs global platforms, which bring scale, with national and regional specialist sources, which bring depth in the markets where the global platforms have less data.
Why do data providers have different coverage by sector?
Because sector skew follows the same logic as market skew, it comes from the same cause: collection method. Providers built on professional-network and web-published data may be stronger wherever employees keep public profiles, and companies publish team pages. These are sectors where being visible online is part of the job.
That strength thins sharply in sectors where the workforce has little reason to be publicly visible, like manufacturing, logistics, construction, and much of the public sector.
A plant supervisor or a procurement officer at a manufacturing firm may be less likely to maintain the kind of public profile a provider’s single-source data ends up matching because nothing about their role puts them online.
Here’s the trap worth naming: a provider’s headline database size is dominated by the sectors it covers well. A platform can be genuinely enormous on B2B data coverage overall, and still close to useless for your vertical — and nothing on its pricing page tells you which sectors make up that number.
Providers skew toward the roles their collection method surfaces. Senior and outward-facing roles get published and scraped heavily. Operational, technical, and procurement roles may not, because nothing about those jobs puts them in public view.
The consequence is that an account looks covered because the CFO and the VP are present, while the people who actually stall or unblock the deal are missing entirely.
It matters more than it sounds. According to Forrester, State of Business Buying 2026, an average of 13 internal stakeholders and 9 external influencers take part in a typical B2B purchase.
Procurement is a decision-maker in 53% of buying cycles. For ABM, that’s the difference between a target account list and buying group coverage you can actually run a programme against.
IMG’s (Intermedia Global Ltd) marketing data enrichment service checks each priority account against the full buying group, i.e., economic, technical, procurement, finance and end users, and keeps cascading until those roles are filled, not just the senior names.
We already pay for a data licence, so why is coverage still bad?
Because the commercial structure makes the gap harder to see, not easier, an annual licence is a sunk cost by the time a coverage gap becomes obvious, and credits already paid for feel free at the point of use. The rational-seeming move is to work the existing tool harder rather than pay again for a second source.
Two consequences follow. The gap stays invisible, because there’s no line item for “sectors we can’t see.” And renewals get decided on usage volume rather than usable output, so a data platform licence can look busy and still be quietly failing the accounts that matter most.
IMG starts from the licence a client already holds, finds where it’s thin, and adds other sources only for those gaps, rather than replacing the platform.
A cascade runs per field. A single contact can be complete on one field and still mid-cascade on another, because fields can be assessed individually with further lookups where the available answer is not usable.
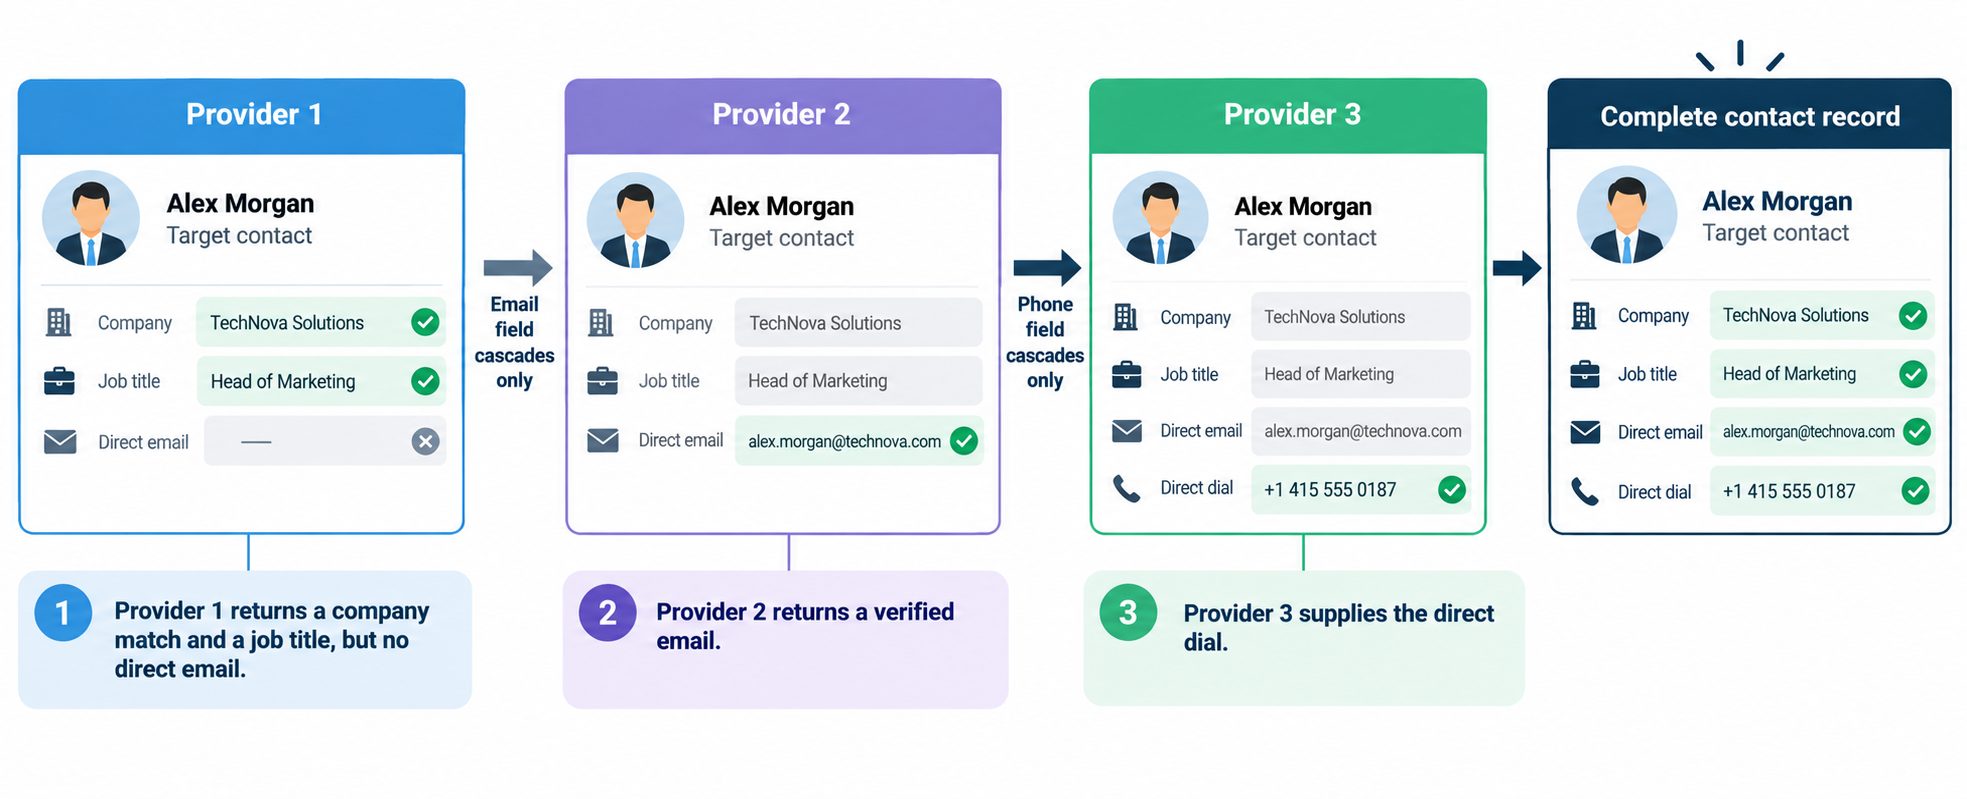
Take one named-role contact at a target account.
“Verified” here is an operational threshold. It means the result has cleared whatever confidence check that field requires, such as a recently confirmed email, a job title matched against two sources, a phone number that’s passed a validity check. A result below that threshold is treated the same as no result: the field keeps cascading.
The order itself is set deliberately, based on which source tends to be strongest for which field and market, so the cheapest reliable answer gets tried first.
That’s the logic behind the enrichment provider sequence. The record only pays for a second or third lookup where the first one genuinely fell short.
In a cascade, IMG (Intermedia Global Ltd) might run the following sequence.
The first source identifies the account and a job title, the second fills the missing verified email, the third adds other members of the buying group, and a specialist source supplies account depth for that market or sector.
There are two ways to run multi-source data enrichment, and they trade off in opposite directions.
The catch is that the first match isn’t always the best match. An affordable early provider can populate a field adequately when a later, pricier provider would have filled it more accurately.
Neither approach wins outright. The real question in sequential vs parallel enrichment is which constraint binds harder for your campaign. Budget and coverage requirements, where sequential may have an advantage, or cross-source comparison, where parallel may help.
Published match rates typically cluster in familiar bands. A single-source platform may land at 40 to 70% raw, and roughly 35 to 60% once results are verified.
A well-run cascade commonly reaches 80 to 95% raw, and 70 to 85% verified.
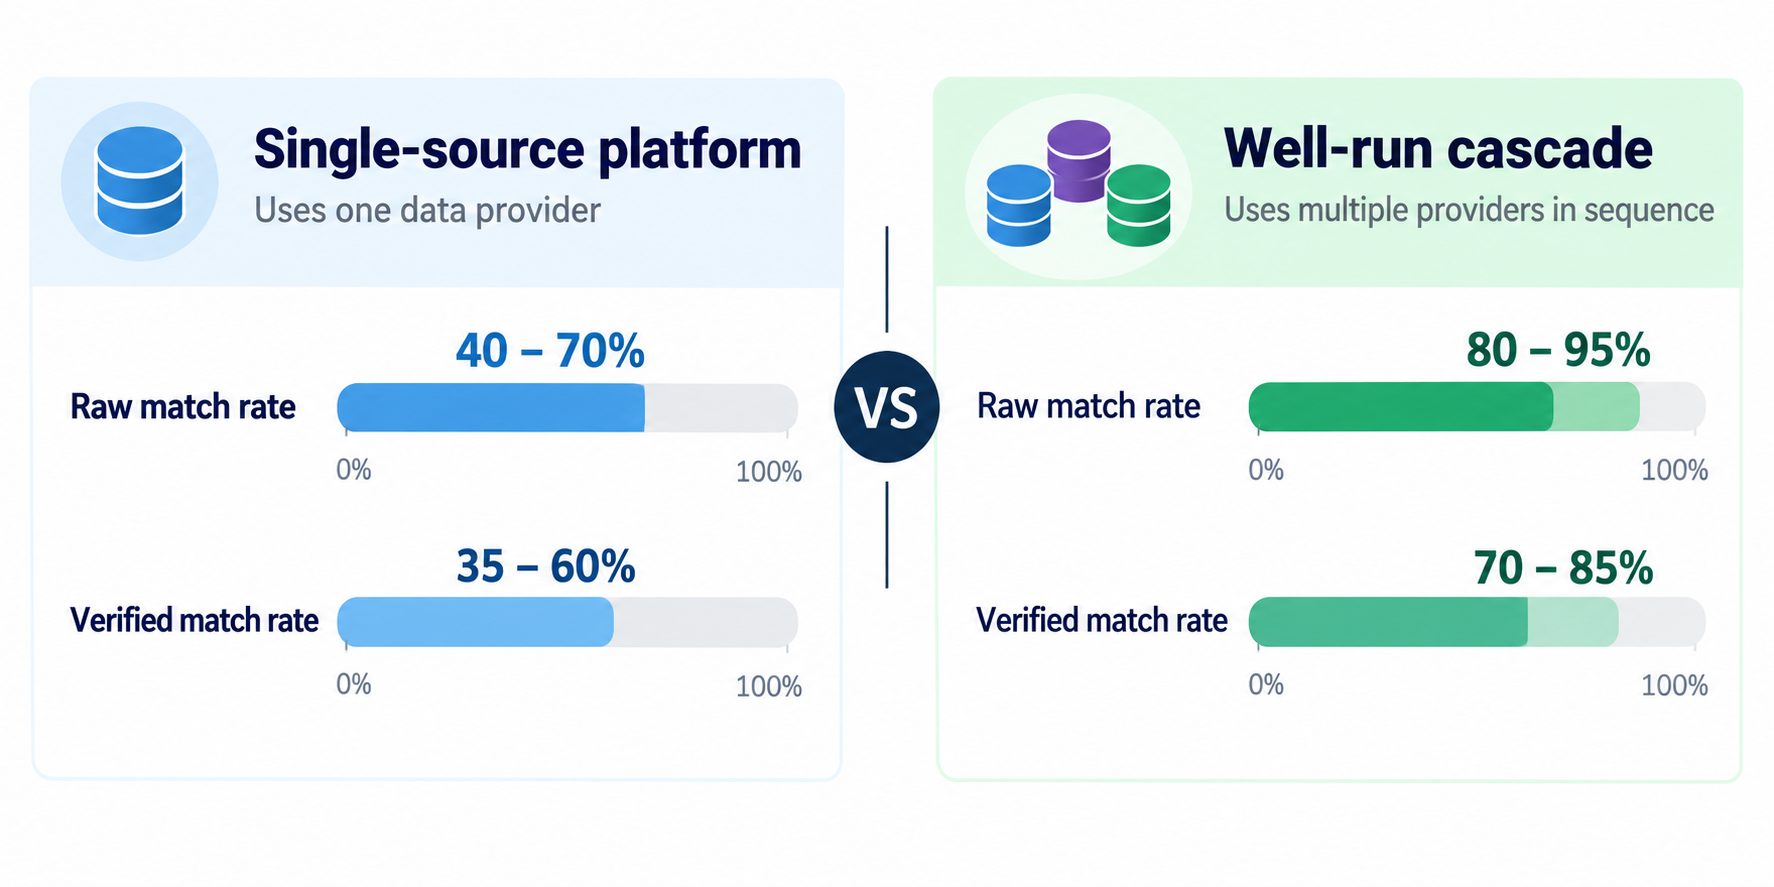
Results vary by field and target audience. Direct-dial information may be harder to find and validate than some company-level attributes. Business email tends to run 55 to 65% single-source against 88 to 95% in a cascade.
Here’s what needs to be said plainly. Vendor-reported match rates are not necessarily independently audited or calculated on a comparable basis.
Your own match rate depends on your ICP, chosen providers, and verification criteria. A single-market, single-sector list can already sit at the high end of single-source rates before a cascade is even run.
Vendor pages focus on match rate and often underplay cost per usable record. Total spend and cost per usable record may rise as you add multiple providers, because queries often are run on records another platform didn’t match completely.
Most waterfall services bill per verified result instead. While underlying tools or providers may charge for lookups, credits or subscriptions, you only pay for complete results. That’s what keeps cost per usable record flat or falling even as coverage climbs.
Check the pricing model before assuming incomplete records and unmatched records are free.
The incremental-lift curve flattens fast. Each additional provider only cascades over what’s left, so it’s working a shrinking pool.
The first provider carries the bulk of the match rate. A second recovers a meaningful share of what the first missed. A third recovers a smaller slice again.
At some point, the gain may become marginal, and the cost per additional match typically exceeds what those last few records are worth.
There’s no fixed number where this happens. The real qualifier is how fragmented your ICP is across market, sector and segment. A single-market, single-sector list may already be done at two providers. A spread, multi-sector list may still be recovering real volume at four.
Most ranking pages treat provider count as the variable that matters. Add a third or fourth source, and coverage goes up. That’s incomplete. Gaps are patterned, so stacking three providers with the same collection method and the same home market reproduces the same blind spot three times, at triple the cost.
Two platforms built on web-scraped profiles are strong in the same sectors and thin in the same ones. You’ve paid twice for one cascade’s worth of B2B data coverage.
What closes a gap is a source whose strengths are complementary to what’s already in the cascade.
The question to ask at every rung isn’t “how many sources do we have?” It’s, “What does this source cover that the ones above it don’t?”
A source that can’t answer that is just adding cost. It’s also the right audit diagnostic that uncovers the overlap between sources, not source count. High overlap means you’re paying for redundancy, not data enrichment match rate.
That’s where waterfall enrichment vs single source stops being a “more is better” story. IMG (Intermedia Global Ltd) chooses sources by overlap, asking at every step what a source covers that the ones above it don’t. The aim is to stop the cascade from repeating the same gaps.
A cascade isn’t always worth running. Here’s when not to use waterfall enrichment.
A single-market, single-sector list already matching above roughly 70% with single-source data has little headroom left.
A cascade on top of that buys marginal records at rising cost, not a meaningful lift. Adding a second or third provider is enrichment spend without an enrichment problem to solve.
Multiple contracts, multiple credentials, routing logic, per-provider monitoring, and periodic reordering are ongoing work.
Source rankings drift as sectors are added, as providers update their own coverage, and as renewal dates land across different months.
Left unmanaged, a cascade degrades back into expensive single-source lookups within a year.
Each one needs its own lawful basis and documented posture, and the weakest provider in the stack sets your overall exposure. Three providers means three data processing relationships to keep current, not one.
Enrichment adds attributes to every record it touches, including duplicates and dead ones. Run a cascade over a messy CRM, and you get a more expensive messy one.
This raises a more fundamental question: what does the CRM need first: cleansing, enrichment or sourcing?
In this case, the answer is cleansing. There is little value in finding more data when you’re still working with duplicate, outdated, or unusable records. IMG (Intermedia Global Ltd) cleanses and deduplicates before enriching, for exactly this reason.
Check your individual reasons to determine whether a cascade is justified, or whether a more basic issue should be addressed first.
IMG (Intermedia Global Ltd), a London-based B2B marketing agency, runs this method the same way for every client: start with the objective, not the tooling.
The sequence begins by establishing the addressable market, the ICP, the buying groups within each priority account.
Only then does IMG (Intermedia Global Ltd) measure current coverage against that target, record by record, to find exactly where the data provider coverage gaps sit.
That audit is what tells IMG (Intermedia Global Ltd) whether a gap sits in email, in mobile, or in buying-group depth and which rung of the cascade needs a different source, not just another one. Sources are added to the cascade for what each one covers that the others don’t, not for how many a client can afford to license.
IMG (Intermedia Global Ltd) works source-agnostically. It builds the cascade from the platforms and licences a client already holds, adding other sources only where those existing platforms are thin, rather than replacing what’s already paid for.
The point of running multi-source data enrichment this way is a marketing data strategy that can actually do the job marketing needs it to do.
That means:
This isn’t waterfall enrichment vs single source as a blanket decision. It depends on how wide your data provider coverage gaps actually are, and how much capacity you have to manage an enrichment provider sequence.
The table below sets out when each approach fits.
| Approach | Best when | Data enrichment match rate to expect | Operational overhead |
|---|---|---|---|
| Single-source | Your ICP sits inside one provider’s strength, i.e. single market, single sector, already matching well | Varies by audience and field; roughly 40 to 70% raw, narrower once verified | Lowest. One contract, one interface, no routing logic |
| Waterfall (multi-source data enrichment) | Your ICP spans multiple markets, sectors or seniority levels, and gaps are costing you reachable accounts | Commonly 80%+ with a well-ordered cascade of three to four sources; test on your data | Highest. Multiple contracts, credentials, monitoring and periodic reordering |
| Hybrid | You already hold a platform licence that performs well in parts of your market | Close to single-source where the licence is strong, closer to waterfall where it’s thin | Moderate. Sources are added only where the existing licence is thin, not run as a full cascade everywhere |
How waterfall enrichment works is the same mechanism in every row, i.e. queries in a fixed order, moving to the next source only on a miss. What changes is how many rungs the cascade needs, and that depends entirely on how fragmented your own target market is.
A thousand contacts, four hundred blanks. Every provider has gaps. The real question is whether those gaps sit where your campaign actually needs coverage, and single-source data can’t answer that on its own.
A coverage gap is not always a data-availability problem. It’s whether your approach can tell you where it’s blind.
Waterfall enrichment vs single source isn’t a debate to settle once. It’s a diagnostic to run against whatever you’re about to activate next, because the gap you can’t see is the one you keep paying to not solve.
How waterfall enrichment works stays the same across every use case, i.e. a fixed enrichment provider sequence, stopping at the first verified result per field. What changes is which data provider coverage gaps matter most for your campaign, and that should decide the source mix, not the other way round.
Multi-source data enrichment is only worth running where the gap is real and costing you something. A strong data enrichment match rate matters less than whether it’s matching in the right places. Start with the gap you can actually name. Then choose sources to close it.
References: